
A new scoring system for operational indicators guiding leprosy monitoring and surveillance in Brazil
 0
0 , ...
, ... Abstract
Objective: We aimed to develop a new score to facilitate and enhance the quantitative assessment of operational standard indicators guiding leprosy monitoring and surveillance, based on data from Brazilian hyperendemic regions, 2004-2019.
Methods: We analyzed epidemiological and operational standard indicators of leprosy control from the database of the Notifiable Diseases Information System in Brazil’s North and Northeast regions. The so-called IntegraHans Operational Score (IHOS) was generated, integrating 10 indicators, with a final semi-quantitative score varying from 0 (worst scenario) to 1 (best scenario). We then applied the IHOS within an ecological and population-based study to assess temporal and spatial leprosy distributions from 2004 to 2019.
Results: In total, 343,888 new leprosy cases were analyzed (61% of cases in the country). There was a significant temporal trend of the IHOS annual percentage change [-0.3; 95% confidence interval (CI): -0.5 to 0.0] during 2010-2019, with large cities showing a worsening trend (average annual percentage change -0.8, 95%CI: -1.1 to -0.4). After 2010, municipalities with low and medium social vulnerability, and those with medium human development and medium and high social prosperity, showed improved IHOS scores. Spatial patterns with the best IHOS scenarios were observed in the states of Rondônia, Tocantins, and Pernambuco.
Conclusion: The IHOS combines different operational parameters and is an effective and simple tool to assess leprosy control programs in Brazil. The worst IHOS scores over time were identified in critical areas, such as large cities in hyperendemic areas and municipalities with lower endemicity.
Keywords
INTRODUCTION
Leprosy is a persistent and neglected chronic infectious disease causing physical, psychological, social, and economic impacts on affected people, their families, and communities[1]. Its long incubation period and complex clinical picture[2], allied with the high burden of morbidity due to neural damage and complications[3,4], bring countless challenges to achieve effective surveillance and control. These aspects are aggravated by the strong association of leprosy with different dimensions of social vulnerability[5], including access to healthcare and other operational challenges in the local and national health systems[6-8].
Globally, about 127,400 new cases (NC) of leprosy were registered in 2020, with 19,195 (15.1%) in the Americas. The disease persists with a high proportion of NC diagnosed with an advanced degree of physical disability [grade 2 disability (G2D) - the highest degree of disability in the WHO classification], particularly in Southeast Asia, Latin America, and Africa[1].
In Latin America, Brazil has the highest new case detection rate and the highest number of NC diagnosed with G2D[1]. The disease is distributed heterogeneously in the country, with high endemicity in the North, Northeast, and Central-West regions[7,9]. Particularly, the states of Pará, Tocantins, Rondônia, and Maranhão in the North and Northeast have shown critical epidemiological and operational standards[9,10].
The control of leprosy in Brazil is based on early detection and therapeutic intervention, aiming to reduce sources of infection and avoid potential sequelae in affected people[11]. In this context, the integrated healthcare network within the Brazilian Unified Health System [Sistema Único de Saúde (SUS)] is pivotal, with a focus on primary healthcare. Therefore, expanding the coverage and quality of the Family Health Teams [Equipes de Saúde da Família (ESF)] is a fundamental strategy to interrupt transmission and qualify healthcare. These measures will also improve monitoring and surveillance of leprosy contacts (defined as people who live or lived up to five years before treatment with a diagnosed case)[2,11]. As part of the group of neglected tropical diseases (NTDs), leprosy is included in the Sustainable Development Goals under Goal 3 (Good Health and Well-Being) in Target 3.3 (By 2030, end the epidemics of AIDS, tuberculosis, malaria and NTDs, and combat hepatitis, waterborne and other communicable diseases)[12], contributing to the high burden of NTDs in the North and Northeast regions of Brazil[10,13].
Disease control based on the Global Strategy for Leprosy 2016-2020 is guided by three pillars: strengthening control with government coordination and partnership, tackling leprosy and its complications, and combating discrimination by promoting inclusion. Monitoring and evaluation of this global strategy are based on three main goals: “zero” children with deformities, < 1 NC per million inhabitants with G2D, and “zero” laws that allow discrimination against people with leprosy[14]. The Brazilian National Strategy for Leprosy Control 2019-2022 aimed to reduce by 44% the number of children with G2D, reduce the general G2D rate to 5.5 cases/1 million, and achieve “zero” stigma and discrimination[15,16].
To achieve these goals in Brazil, a broad characterization of each municipality in the country was established based on specific epidemiological and operational indicators[10,15,16]. The municipalities were classified considering the detection rate of NC and other indicators that impact the leprosy burden. These indicators include the detection rate of NC with G2D at diagnosis, the proportion of examined leprosy NC contacts diagnosed in the years of the cohorts, and the proportion of leprosy NC with the degree of physical disability assessed at diagnosis[16]. There is a need to develop integrated strategies and analysis at the municipal level in areas with high endemicity.
The integration of monitoring and control indicators into a standardized semi-quantitative score increases the chance of operationalizing this process at the local level to standardize the assessment of the leprosy control programs over time and between regions. In this context, we aimed to develop a new score to facilitate and enhance the quantitative assessment of operational standard indicators guiding leprosy monitoring and surveillance, based on data from Brazilian hyperendemic regions, 2004-2019. The score will help to assess operational standards, guide leprosy monitoring and surveillance, and identify bottlenecks of leprosy control programs.
METHODS
Study areas
This study was performed in the 16 Brazilian federal states that comprise the North (Acre, Amapá, Amazonas, Pará, Rondônia, Roraima, and Tocantins) and Northeast (Alagoas, Bahia, Ceará, Maranhão, Paraíba, Pernambuco, Piauí, Rio Grande do Norte, and Sergipe) regions [Figure 1]. The North region has 3.9 million km2, the largest territorial area in the country, and the lowest demographic density (4.12 inhabitants per km2). In comparison, the Northeast has an area of 1.6 million km2 with a population density of 34.15 inhabitants per km2[17,18]. These two regions have a total population of about 75 million, about 35% of Brazil’s total population. The 16 states of the region were selected for this study, as they are classified as highly endemic for leprosy and a priority region for leprosy control[15,16].
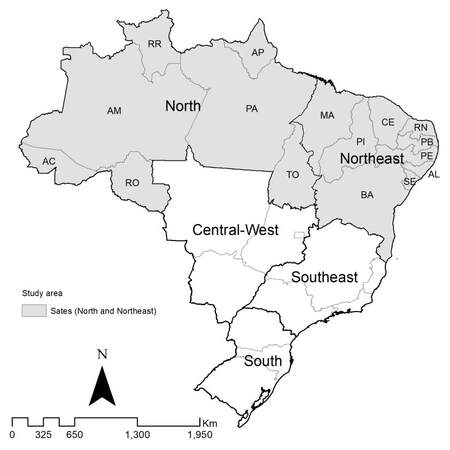
Figure 1. States in the North and Northeast regions of Brazil included in the study.
The North region showed an improvement in the human development Index (HDI), from 0.713 in 2015 to 0.734 in 2019, and in the Gini index, from 0.50 in 2015 to 0.55 in 2019. This favorable pattern was also observed in the Northeast region, where the HDI increased from 0.706 in 2015 to 0.727 in 2019, and the Gini index increased from 0.51 in 2015 to 0.57 in 2019[18].
Study design
First, we developed the new score, and in a second step, an ecological study was performed.
For the first step, we performed a statistical analysis of operational indicators of leprosy control from Brazil’s North and Northeast regions from 2004 to 2019. We used data from the nationwide Notifiable Diseases Information System [Sistema de Informação de Agravos de Notificação (SINAN-MS)]. The new score denominated IntegraHans Operational Score (IHOS) was built by integrating selected indicators. In the second step, we evaluated the application of the new score based on the combination of the operational indicators within an ecological and population-based study using municipalities as units of analysis, including temporal and spatial approaches.
Elaboration of IHOS
The Brazilian leprosy control program of the Ministry of Health uses a series of standard operational indicators. We included four indicators for measuring progress in achieving the objectives of a leprosy control program. (usefulness: (1) effectiveness of the activities of timely and/or early case detection; (2) transcendence of the disease and subsidizing the programming of actions for prevention and treatment of disabilities in the post-discharge; (3) capacity of services to assist leprosy cases; and (4) cases at risk of developing complications and replenishment of polychemotherapy) and six indicators for measuring the coverage and quality of health services for leprosy control actions (usefulness: (1) quality of attention and follow-up of new cases diagnosed until the completion of treatment; (2) capacity of services to carry out surveillance of contacts of new leprosy cases, increasing the timely detection of new cases; (3) identification of municipalities notifying relapse cases for monitoring therapeutic failure; and (4) measuring of the quality of care in Health Services) [Table 1]. Due to the existence of indicators that use the case reference, the analysis included two years, according to the recommendations of the Brazilian Ministry of Health (MoH)[11].
Operational indicators included in the IHOS, to guide leprosy monitoring and surveillance with parameters, categorization, and source
| Leprosy indicators | Indicator number | Parameters/categorization | |||
| High/ Precarious (0) | Medium/ Regular (1) | Low/ Good (2) | Source | ||
| Indicators for monitoring the progress of leprosy control as a public health problem: | |||||
| Proportion of leprosy cases with G2D at the time of diagnosis among the NC detected and evaluated in the year | 1 | ≥ 10% | 5% to 9.9% | < 5% | MoHa |
| Proportion of leprosy cases cured with G2D among the cases assessed at the time of discharge for cure in the year | 2 | ≥ 10% | 5% to 9.9% | < 5% | MoHa |
| Proportion of leprosy cases, according to gender, among the total of NC (Proportion of women) | 3 | ≥ 60% | 51% to < 60% | < 50% | Newb |
| Proportion of cases according to operational classification among the total of NC (Proportion of multibacillary) | 4 | ≥ 90% | 75 to 89.9% | < 75% | MoHa |
| Indicators to assess the coverage and quality of health services for leprosy control actions: | |||||
| Proportion of leprosy cure among NC diagnosed in the years of the cohorts | 5 | < 75% | ≥ 75% to 89.9% | ≥ 90% | MoHa |
| Proportion of leprosy cases in treatment abandonment among NC diagnosed in the years of the cohorts | 6 | ≥ 25% | 10% to 24.9% | < 10% | MoHa |
| Proportion of examined leprosy NC contacts diagnosed in the years of the cohorts | 7 | < 75,0% | ≥ 75.0% to 89.9% | ≥ 90.0% | MoHa |
| Proportion of recurrence cases among reported cases in the year | 8 | ≥ 5% | 1.5% to < 5.0% | < 1.5% | Newb |
| Proportion of leprosy NC with degree of physical disability assessed at diagnosis | 9 | < 75% | ≥ 75% to 89.9% | ≥ 90% | MoHa |
| Proportion of cases cured in the year with degree of physical disability assessed among the leprosy NC in the period of the cohorts | 10 | < 75% | ≥ 75% to 89.9% | ≥ 90% | MoHa |
After calculating the indicators and stratifying the results according to the official parameters, an integrated analysis was carried out by constructing the operational score (IHOS). Therefore, from the categories defined for each indicator, three specific weighting factors were defined for each parameter, considering the study categorization for each indicator [Table 1].

where xi is the value of the ten operational indicators for a given municipality and n corresponds to all other mun-icipalities.
We performed the standardization of the values of each indicator using the following formula:

where Standardized IHOS is the standardized value of IHOS, max IHOS is the highest value of IHOS among all municipalities, and min IHOS is the lowest value. Each operational indicator’s score was added according to the year of analysis and municipality of residence, generating a final operational score IHOS, ranging from 0 to 1. In the end, a classification was established in which the closer the value is to 1, the better is the operational scenario (Low/Best); conversely, the closer the value is to 0, the worse is the operational scenario (High/Worst).
Data sources
Secondary data related to leprosy NC were obtained from the Brazilian MoH Notifiable Diseases Information System (Sistema de Informação de Agravos de Notificação-Ministério da Saúde (SINAN-MS)), directly from the General Coordination of Leprosy and Diseases Target for Elimination [Department of Surveillance of Communicable Diseases, Secretariat of Health Surveillance, MoH (CGHDE/DEVIT/SVS-MS)]. All records with “diagnostic error” as output criteria were excluded[11].
We included sociodemographic data in the analysis according to the Social Vulnerability Index [Índice de Vulnerabilidade Social (SVI)], the Municipal Human Development Index [Índice de Desenvolvimento Humano Municipal (IDHM)], and the categories of Social Prosperity [Prosperidade Social (PS)].
The SVI is a quality-of-life index widely used in Brazil, measuring the level of inclusion or exclusion and the social vulnerability considering economic, environmental, legal, cultural, and safety dimensions per municipality. This social indicator was obtained from the Social Vulnerability Atlas (Atlas de Vulnerabilidade Social) from the Institute for Applied Economic Research (Instituto de Pesquisa Econômica Aplicada). The SVI is calculated by integrating 16 indicators of this platform and is organized in three dimensions: (1) urban infrastructure, (2) human capital, (3) income and work[18].
The IDHM includes three social dimensions of the global IDH, namely longevity, education, and income, adapting the global method to the Brazilian context by using available data from the National Census from 2010[18]. The PS is the simultaneous occurrence of high human development with low social vulnerability. The cross-analysis of the categories of IDHM (Low/Very low, Medium, and High/Very high) and SVI (Low/Very low, Medium, and High/Very High) generates the PS categories[18].
Data analysis
For the ecological study, the IHOS score was used as the outcome variable, with municipalities being the units of analysis. We calculated the means and standard deviations of the IHOS to analyze the variation by municipality according to the regions included (North and Northeast, combined or individually), municipal size (small size I: < 20,000 inhabitants; small size II: 20,001-50,000 inhabitants; medium size: 50,001-100,000 inhabitants; large size: > 100,001 inhabitants), SVI (very low: 0.000-0.199; low: 0.200-0.299; medium: 0.300-0.399; high: 0.400-0.499; very high: 0.500-1.000), IDHM (very low: 0.000-0.499; low: 0.500-0.599; medium: 0.600-0.699; high: 0.700-0.799; very high: 0.800-1.00), and PS categories (worst indexes are the result of low IDHM and high SVI, while the best ones have higher IDHM and low SVI). The IHOS score was stratified according to region, size of municipality, and SVI.
For the analysis of the spatial distribution of the IHOS, four time periods were observed separately (2004-2007, 2008-2011, 2012-2015, and 2016-2019), with the calculation of the mean for each period. The score distribution was divided for choropleth maps class using natural breaks criteria by the Jenks classification algorithm, reducing the edge effect of the scores, and the interclass variation, maximizing this variation.
To analyze the temporal trends of the IHOS mean, Poisson’s Joinpoint regression (by inflection points) was performed using the Joinpoint Regression Program version 4.6.0.0 (Statistical Methodology and Applications Branch, Surveillance Research Program, National Cancer Institute). This technique regulates the adjustment of the inflection points, as well as their series of lines. The Monte Carlo permutation method, as a test of statistical significance, sought to reach the best line of each analyzed segment. To calculate the trend of the mean, the routine “Heteroscedastic Errors”, option “Standard Error”, was selected, defining the IHOS mean as a parameter with their respective standard errors.
To analyze the spatial distribution and the spatiotemporal patterns of the IHOS, the municipality of residence was used as the geographic unit for analysis proposal (n = 2244; 2013 territorial division). Records in which the municipality of residence was unknown were excluded.
Statistical analyses were performed using the software Stata version 11.2 (Stata Statistical Software: Release 12. College Station, TX: StataCorp LP). QGIS version 2.18.6 (QGIS Development Team. QGIS Geographic Information System. Open Source Geospatial Foundation Project. http://qgis.osgeo.org) was used for the calculation of spatial autocorrelation indicators and the construction of thematic maps.
Ethical aspects
The study followed the recommendations of the National Health Council in Resolution 466 of 12 December 2012. The analysis was based exclusively on anonymous secondary data from publicly available sources, without the possibility of identifying the people affected. Thus, approval of an ethical review board was not necessary.
RESULTS
During the study period, 348,901 leprosy NC were recorded in the study area (61.0% of the country’s total cases), with a mean number of 21,806.3 cases per year. Of these, 20,621 (5.9%) were diagnosed with G2D, 157,398 (45.1%) were female, and 205,017 (58.8%) were classified as multibacillary cases. There were 15,423 (4.4%) cases of recurrence and 1,220,995 registered household contacts (overall mean of 76,489 contacts/year and mean of 3.53 contacts per NC), with 771,541 (63.2%) contacts examined (mean of 65.0% per year).
The IHOS presented a similar mean in the North and Northeast regions (mean of 0.6590 and standard deviation of 0.0067 and mean of 0.6461 and standard deviation of 0.0031, respectively). In the North region, the best mean values of IHOS were observed for the states of Acre and Rondônia (mean of 0.7267 and standard deviation of 0.0269 and mean of 0.7083 and standard deviation of 0.0201, respectively). In the Northeast region, the states with the best IHOS were Pernambuco and Sergipe (mean of 0.6885 and standard deviation of 0.0105 and mean of 0.6803 and standard deviation of 0.0155, respectively). We detected different levels of IHOS for regions. The North region showed a downward trend during 2010-2019 [APC: -0.3 (95%CI: -0.9 to -0.3)]. However, the Northeast region showed a significant upward trend during 2004-2011 [APC 0.5 (95%CI: 0.1 to 0.9)] [Table 2]. Indicators 1, 2, 4, and 6 [Table 1] contributed to better scores in the periods 2004-2007, 2008-2010, and 2011-2019 [Supplementary Tables 1 and Supplementary Table 2].
Joinpoint regression analysis of the means of the total IHOS and IHOS stratified by region, size of municipality, and SVI. North and Northeast regions of Brazil, 2004-2019
| Variable | Trends 1 | Trends 2 | Trends 3 | Total Period | |||
| Period | APC (IC 95%) | Period | APC (IC 95%) | Period | APC (IC 95%) | AAPC (95%CI) | |
| IHOS total | 2004-2007 | -0.4 (-1.4 to 0.7) | 2007-2010 | 1.3 (-1.0 to 3.7) | 2010-2019 | -0.3* (-0.5 to 0.0) | 0.1 (0.0 to 0.3) |
| Region | |||||||
| North | 2004-2007 | -1.1 (-2.4 to 0.2) | 2007-2010 | 2.0 (-1.1 to 5.1) | 2010-2019 | -0.6* (-0.9 to -0.3) | 0.0 (-0.3 to 0.2) |
| Northeast | 2004-2011 | 0.5* (0.1 to 0.9) | 2011-2019 | -0.1 (-0.5 to 0.2) | 0.2* (0.0 to 0.3) | ||
| Size of municipality | |||||||
| Small size I | 2004-2011 | 0.5* (0.1 to 0.8) | 2011-2019 | -0.2 (-0.5 to 0.1) | 0.1* (0.0 to 0.3) | ||
| Small size II | 2004-2007 | -0.5 (-1.8 to 0.9) | 2007-2010 | 1.6 (-1.6 to 5.0) | 2010-2019 | -0.2 (-0.4 to 0.1) | 0.2* (0.1 to 0.4) |
| Medium size | 2004-2012 | 0.6* (0.1 to 1.1) | 2012-2019 | -0.8* (-1.4 to -0.2) | 0.0 (-0.3 to 0.2) | ||
| Large size | 2004-2012 | -0.1 (-0.8 to 0.7) | 2012-2019 | -1.7* (-2.7 to -0.7) | -0.8* (-1.1 to -0.4) | ||
| SVI | |||||||
| Low | 2004-2019 | -0.3 (-0.7 to 0.1) | -0.3 (-0.7 to 0.1) | ||||
| Medium | 2004-2019 | -0.1 (-0.2 to 0.1) | -0.1 (-0.2 to 0.1) | ||||
| High | 2004-2019 | 0.2 (0.0 to 0.3) | 0.2 (0.0 to 0.3) | ||||
| Very high | 2004-2019 | 0.2* (0.1 to 0.3) | 0.2* (0.1 to 0.3) | ||||
| IDHM | |||||||
| Very low | 2004-2019 | -0.3 (-0.7 to 0.0) | -0.3 (-0.7 to 0.0) | ||||
| Low | 2004-2011 | 0.5* (0.0 to 0.9) | 2011-2019 | -0.1 (-0.5 to 0.3) | 0.2* (0.0 to 0.3) | ||
| Medium | 2004-2012 | 0.5* (0.1 to 0.8) | 2012-2019 | -0.4 (-0.8 to 0.1) | 0.1 (-0.1 to 0.3) | ||
| High | 2004-2014 | 0.2 (-0.3 to 0.7) | 2014-2019 | -3.1* (-4.8 to -1.4) | -0.5* (-1.0 to -0.1) | ||
| PS | |||||||
| Very low | 2004-2011 | 0.5* (0.0 to 0.9) | 2011-2019 | -0.1 (-0.5 to 0.3) | 0.2* (0.0 to 0.3) | ||
| Low | 2004-2019 | 0.2* (0.0 to 0.4) | 0.2* (0.0 to 0.4) | ||||
| Medium | 2004-2010 | 0.5 (-0.1 to 1.1) | 2010-2019 | -0.4* (-0.8 to -0.1) | -0.1 (-0.3 to 0.1) | ||
| High | 2004-2019 | -0.4 (-0.7 to 0.0) | -0.4 (-0.7 to 0.0) | ||||
| Very high | 2004-2012 | 0.9* (0.0 to 1.8) | 2012-2019 | -2.2* (-3.4 to -1.1) | -0.4 (-0.9 to 0.2) | ||
Municipalities with a population < 20,000 inhabitants showed an increase in the period 2004-2011 [APC: 0.5 (95%CI: 0.1-0.8)], while the most populous ones showed a decrease in the period 2012-2019 [APC: -1.7 (95%CI: -2.7 to -0.7)]. The municipalities with “low”, “medium”, and “high” SVI did not present a clear trend for the study period. The municipalities with “very high” SVI had an increase throughout the period [APC: 0.2 (95%CI: 0.1-0.3)] [Table 2].
Significant trends were identified for “low” IDHM with an increase in the period 2004-2011 [APC: 0.5 (95%CI: 0.0-0.9)], “medium” IDHM with an increase from 2014 to 2012 [APC: 0.5 (95%CI: 0.1-0.8)], and “high” IDHM trend decreased from 2014 to 2019 [APC: -3.1 (95%CI: -4.8 to -1.4)] [Table 2].
Municipalities with “very low” IPS showed an increase in the trend in the period 2004-2011 [APC: 0.5 (95%CI: 0.0-0.9)], while those with “low” IPS showed an increase in the entire period [APC: 0.2 (95%CI: 0.0- 0.4)]. Municipalities with “medium” IPS showed a downward trend from 2010 to 2019 [APC: -0.4 (95%CI: -0.8 to -0.1)]. Municipalities with “very high” IPS showed an increase during 2004-2012 [APC: 0.9 (95%CI: 0.0-1.8)] and a decrease during 2012-2019 [APC: -2.2 (95%CI: - 3.4 to -1.1)] [Table 2].
The spatial distribution of the IHOS revealed low scores in the four periods in the states of Roraima, Amapá, Pará, Maranhão, Bahia, northern Ceará, Rio Grande do Norte, and Paraíba. The other states and regions showed municipalities with higher IHOS [Figure 2]. A worsening of the spatial pattern of the IHOS was observed in the states of Roraima, Maranhão, southern Ceará, northern and southern Bahia, Amapá, Rio Grande do Norte, and Paraíba. The states of Rondônia, Pernambuco, and Tocantins showed improvement in the spatial patterns of the IHOS. The states of Amazonas, Piauí, Sergipe, Pará, and Sergipe showed irregular spatial patterns over time [Figure 2].
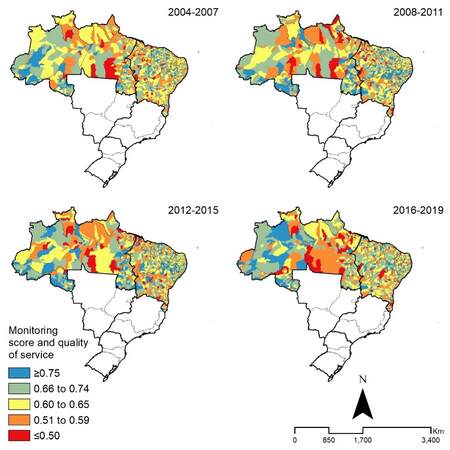
Figure 2. Distribution of the mean final score (IHOS) for the synthesis of leprosy operational indicators, by municipalities in the North and Northeast regions of Brazil, 2004-2019. IHOS: IntegraHans Operational Score.
DISCUSSION
We developed and evaluated a new integrated score aimed at improving the leprosy monitoring and surveillance process in a high endemicity region. The IHOS is based on ten leprosy indicators: six monitor the progress of disease control and magnitude, and four are related to the evaluation of coverage and quality of health services[2,11]. The IHOS can be seen as a sensitive and reproducible measure in the Brazilian context, facilitating epidemiological analysis and decision making.
The ecological study showed that the IHOS improved over this 16-year period in Brazil’s North and Northeast regions, but that operational standards worsened over time, mainly in critical areas such as large cities and areas of less severe endemicity. There was a differential pattern with a higher score in municipalities with a higher SVI, in addition to a worsening trend for large municipalities. The spatial distribution of IHOS showed the relative improvement in performance in areas of greater endemicity.
The increased proportion of NC with G2D at diagnosis indicates operational limitations in the healthcare network. This critical situation was found in other studies, such as in the state of Maranhão during 2001-2009, whose municipalities were included in high-risk clusters for detection[19]. This indicator’s worsening over time reflects the persistence of leprosy with late diagnosis due to low timely detection and sustained existence of hidden prevalence[20]. We emphasized the need for monitoring the endemic trend and the inclusion of these findings in the planning of actions at the state and municipal levels[10].
The Northeast region had the highest IHOS, with an increasing trend, being the region with the worst performance of health services, including developing contact surveillance actions[11]. The states of Amapá, Rio Grande do Norte, and Paraíba had the lowest scores, but also the lowest NC detection rates in the general population and in children < 15 years, in addition to low coverage of contact tracing and low cure rates[9,21]. The spatial patterns revealed a reduction of IHOS for Amapá and Rio Grande do Norte, indicating a relative worsening of health services in developing control actions, with the persistence of negative parameters. There was a temporal trend of reduction of the IHOS for large municipalities. In the state of Bahia, municipalities with less than 100,000 inhabitants had a higher risk of detection rates in the general population, in children < 15 years, and cases with G2D at diagnosis, as compared to larger municipalities[3].
Municipalities with “medium” to “very high” SVI, considered with “worst performance”, presented the highest IHOS. In a study from an endemic capital of the Northern region of Brazil, there was a concentration of cases with social vulnerability, evidencing the existence of unreported cases[22]. Increased equity in relation to income, education, and access to quality health services, if overcome, would contribute to more effective leprosy control actions[13,23]. Conversely, in municipalities with a high detection cluster in Brazil, there was a higher detection rate in smaller municipalities as compared to their larger neighbors, with a better-structured healthcare network[24].
In an endemic state of the Northeast region, spatial analysis highlighted the relevance of high endemic areas with precarious operational indicators[20]. Other studies have an inverse relationship, such as that carried out in a hyper-endemic state in North Brazil, where the highest detection rates were associated with better operational indicators[6]. In our spatial analysis of the IHOS, areas of high leprosy detection rates were highlighted, and areas of high endemicity presented the “best” IHOS. It is essential to recognize regions with low levels of endemicity, as well as whether this context is the result of operational aspects due to NC detection low capacity by the SUS healthcare network[10,13].
The present study is subject to limitations. Secondary data originating from the SINAN database may be partially incomplete due to underreporting of cases or insufficient completeness in filling specific case data, but previous studies have shown that, during the study period, the coverage of SINAN was good and did not vary considerably among the regions[13,25,26]. The operational pattern for registration of leprosy cases between municipalities in the North and Northeast regions may differ regarding reported and uninvestigated data, as presented in the MoH report, which, by analyzing operational indicators, showed differences among the regions[10,27]. This new scale is to be statistically standardized and validated prior to recommending for national use. Despite these aspects, we believe that this score is a practical and useful tool, considering the focus of this study on the development of an innovative and synthetic score to increase the response capacity of municipalities and their assessment in contexts of high endemicity. A consistent 16-year historical series was included, with a national database, selecting data from the North and Northeast, minimizing variability and effects related to incompleteness and inconsistency, combined with the multiple techniques and rigor used in data analysis.
In conclusion, the IHOS obtained by combining 10 different operational indicators is a simple and effective tool to detect areas for improvement and to enhance leprosy monitoring and surveillance in Brazil. Operational standard indicators can be quantified and observed over time. The approach still needs to be evaluated systematically before being adopted as a government policy. As recommendations, we further emphasize the need to improve leprosy surveillance and control actions based on strengthening the monitoring and evaluation component in all SUS instances. The persistence of critical operational problems in the healthcare and surveillance network makes the challenge of leprosy control even more complex in the face of social inequalities. This fact demands not only the strengthening of SUS, but also the development of intersectoral policies for human development and the reduction of critical inequalities in Brazil.
DECLARATIONS
AcknowledgmentsFerreira AF received a master's scholarship from the National Council for Scientific and Technological Development (Conselho Nacional de Desenvolvimento Científico e Tecnológico, CNPq). GSM García is a doctoral fellow at the Ceará State Foundation for Support to Scientific and Technological Development of the Government of the State of Ceará (Fundação Cearense de Apoio ao Desenvolvimento Científico e Tecnológico do Governo do Estado do Ceará, FUNCAP-CE). Reis AS received a master's scholarship from the Coordination for the Improvement of Higher Education Personnel (Coordenação de Aperfeiçoamento de Pessoal de Nível Superior, CAPES). Andrade TIB is a CAPES master fellow. Ramos Jr. AN and Heukelbach J are research fellows from CNPq/Brazil.
Authors’ contributionsFerreira AF, Heukelbach J and Ramos Jr. AN were responsible for study concept and design. Ferreira AF, Ramos Jr. AN, Souza EA, Heukelbach J and García GSM conducted the study and the statistical analysis. Ferreira AF, Ribeiro Filha C, Braga JU, Heukelbach J, Oliveira MLW and Corona F were responsible for interpretation of data. Ferreira AF, Andrade ESN, Sena Neto SA and Andrade TIB drafted the manuscript. All authors critically revised the manuscript for intellectual content, read and approved the final manuscript.
Availability of data and materialsNot applicable.
Financial support and sponsorshipPostgraduate Support Program (Programa de Apoio à Pós-Graduação, PROAP) of the CAPES. CNPq for financing the IntegraHans North and Northeast Project (Process 404505/2012).
Conflicts of interestAll authors declared that there are no conflicts of interest.
Ethical approval and consent to participateNot applicable.
Consent for publicationNot applicable.
Copyright© The Author(s) 2022.
Supplementary MaterialsREFERENCES
1. WHO. Global leprosy (Hansen disease) update, 2020: impact of COVID-19 on global leprosy control. Available from: http://apps.who.int/iris/bitstream/handle/10665/345048/WER9636-eng-fre.pdf [Last accessed on 12 Apr 2022].
2. Brasil. Guia de Vigilância em Saúde. Available from: https://www.saude.pr.gov.br/sites/default/arquivos_restritos/files/documento/2020-04/volume-unico-2017.pdf [Last accessed on 12 Apr 2022].
3. Amorim de Souza E, Fuentes Ferreira A, Heukelbach J, et al. Epidemiology and spatiotemporal patterns of leprosy detection in the state of bahia, brazilian northeast region, 2001 - 2014. Trop Med Infect Dis 2018;3:79.
4. Rao PSS, Darlong F, Timothy M, et al. Disability adjusted working life years (DAWLYs) of leprosy affected persons in India. Indian J Med Res 2013;137:907.
5. Martins PV, Iriart JAB. Itinerários terapêuticos de pacientes com diagnóstico de hanseníase em Salvador, Bahia. Physis 2014;24:273-89.
6. Monteiro LD, Mota RMS, Martins-Melo FR, Alencar CH, Heukelbach J. Social determinants of leprosy in a hyperendemic state in North Brazil. Rev Saude Publica 2017;51:70.
7. Freitas LR, Duarte EC, Garcia LP. Leprosy in Brazil and its association with characteristics of municipalities: ecological study, 2009-2011. Trop Med Int Health 2014;19:1216-25.
8. Souza EA, Boigny RN, Ferreira AF, Alencar CH, Oliveira MLW, Ramos AN Jr. [Programmatic vulnerability in leprosy control: gender-related patterns in Bahia State, Brazil]. Cad Saude Publica 2018;34:e00196216.
9. Brasil. Boletim epidemiológico - hanseníase. Available from: http://portalarquivos2.saude.gov.br/images/pdf/2018/janeiro/31/2018-004-Hanseniase-publicacao.pdf [Last accessed on 12 Apr 2022].
10. Ferreira AF, Amorim de Sousa E, Soledad Márdero García G, et al. Leprosy in the North and Northeast regions of Brazil: an integrated spatiotemporal approach. Trop Med Int Health 2020;25:193-208.
11. Brasil. Diretrizes para a vigilância, atenção e eliminação da Hanseníase como problema de saúde pública: manual técnico-operacional. Available from: http://www.saude.gov.br/images/pdf/2016/fevereiro/04/diretrizes-eliminacao-hanseniase-4fev16-web.pdf [Last accessed on12 Apr 2022].
12. PNUD. Acompanhando a agenda 2030 para o desenvolvimento sustentável: subsídios iniciais do Sistema das Nações Unidas no Brasil sobre a identificação de indicadores nacionais referentes aos objetivos de desenvolvimento sustentável. Available from: http://www.pnud.org.br/Docs/Acompanhando_Agenda2030-Subsidios_iniciais-Brasil.pdf [Last accessed on 12 Apr 2022].
13. Brasil. Doenças negligenciadas no Brasil: vulnerabilidade e desafios. SAÚDE BRASIL 2017: Uma análise da situação de saúde e os desafios para o alcance dos Objetivos de Desenvolvimento Sustentável. Available from: https://bvsms.saude.gov.br/bvs/publicacoes/saude_brasil_2017_analise_situacao_saude_desafios_objetivos_desenvolvimento_sustetantavel.pdf [Last accessed on 12 Apr 2022].
14. WHO. Global leprosy strategy 2016-2020: accelerating towards a leprosy-free world. Available from: http://apps.who.int/iris/bitstream/10665/250119/5/9789290225256-Eng.pdf [Last accessed on 12 Apr 2022].
15. Brasil. Boletim epidemiológico. Available from: http://www.aids.gov.br/system/tdf/pub/2016/67123/boletim-hanseniase-2020-web.pdf?file=1&type=node&id=67123&force=1 [Last accessed on 12 Apr 2022].
16. Brasil. Estratégia Nacional para o Enfrentamento da Hanseníase - 2019 - 2022. Ministério da Saúde - Secretaria de Vigilância em Saúde - Departamento de Doenças de Condições Crônicas e Infecções Sexualmente Transmissíveis. Available from: http://www.aids.gov.br/system/tdf/pub/2016/67207/estrategia_nacional_de_hanseniase_2019-2022_web.pdf?file=1&type=node&id=67207&force=1 [Last accessed on 12 Apr 2022] .
17. IBGE. Instituto Brasileiro de Geografia e Estatística-IBGE. Available from: https://www.ibge.gov.br/ [Last accessed on 12 Apr 2022].
18. IPEA. Atlas da Vulnerabilidade Social nos Municípios Brasileiros. Available from: http://ivs.ipea.gov.br [Last accessed on 12 Apr 2022].
19. Alencar CH, Ramos Jr AN, Barbosa JC, et al. Persisting leprosy transmission despite increased control measures in an endemic cluster in Brazil: the unfinished agenda. Lepr Rev 2014;83:344-53.
20. Souza EA, Ferreira AF, Boigny RN, et al. Leprosy and gender in Brazil: trends in an endemic area of the Northeast region, 2001-2014. Rev Saude Publica 2018;52:20.
21. Ministério da Saúde - Brasil. Situação Epidemiológica - Dados. Available from: http://portalms.saude.gov.br/saude-de-a-z/hanseniase/situacao-epidemiologica [Last accessed on 12 Apr 2022].
22. Imbiriba EN, Silva Neto AL, Souza WV, Pedrosa V, Cunha Mda G, Garnelo L. Social inequality, urban growth and leprosy in Manaus: a spatial approach. Rev Saude Publica 2009;43:656-65.
23. Cabral-Miranda W, Chiaravalloti Neto F, Barrozo LV. Socio-economic and environmental effects influencing the development of leprosy in Bahia, north-eastern Brazil. Trop Med Int Health 2014;19:1504-14.
24. Alencar CH, Ramos AN Jr, Sena Neto SA, et al. [Leprosy diagnosis in municipalities other than the patients' place of residence: spatial analysis, 2001-2009]. Cad Saude Publica 2012;28:1685-98.
25. Galvão PRS, Ferreira AT, Maciel MGG, et al. Uma avaliação do sistema de informação SINAN usado no Programa de Controle de Hanseníase no estado do Pernambuco, Brasil. Cad Saúde Coletiva 2009;17:87-102. Available from:
26. Ramos Jr AN, Heukelbach J, Gomide M, Hinders DC, Schreuder PM. Investigações em sistemas de serviços de saúde como ferramenta para o alcance de programas de controle da hanseníase mais efetivos no Brasil. Cad saúde colet, (Rio J) 2008;16:147-68. Available from:
27. Ministério da Saúde (BR). Boletim Epidemiológico de Hanseníase 2022. Available from: http://www.aids.gov.br/pt-br/pub/2022/boletim-epidemiologico-de-hanseniase-2022 [Last accessed on 12 Apr 2022].
Cite This Article
Export citation file: BibTeX | RIS
OAE Style
Ferreira AF, Heukelbach J, Souza EA, García GSM, Filha CR, Braga JU, Oliveira MD, Reis AS, Corona F, Neto SAS, Andrade ESN, Andrade TIB, Jr ANR. A new scoring system for operational indicators guiding leprosy monitoring and surveillance in Brazil. One Health Implement Res 2022;2:29-41. http://dx.doi.org/10.20517/ohir.2021.09
AMA Style
Ferreira AF, Heukelbach J, Souza EA, García GSM, Filha CR, Braga JU, Oliveira MD, Reis AS, Corona F, Neto SAS, Andrade ESN, Andrade TIB, Jr ANR. A new scoring system for operational indicators guiding leprosy monitoring and surveillance in Brazil. One Health & Implementation Research. 2022; 2(2): 29-41. http://dx.doi.org/10.20517/ohir.2021.09
Chicago/Turabian Style
Ferreira, Anderson Fuentes, Jorg Heukelbach, Eliana Amorim de Souza, Gabriela Soledad Márdero García, Carmelita Ribeiro Filha, José Ueleres Braga, Maria Leide Wan-Del-Rey Oliveira, Adriana da Silva dos Reis, Francesco Corona, Sebastião Alves de Sena Neto, Elaine Silva Nascimento Andrade, Thainá Isabel Bessa de Andrade, Alberto Novaes Ramos Jr. 2022. "A new scoring system for operational indicators guiding leprosy monitoring and surveillance in Brazil" One Health & Implementation Research. 2, no.2: 29-41. http://dx.doi.org/10.20517/ohir.2021.09
ACS Style
Ferreira, AF.; Heukelbach J.; Souza EA.; García GSM.; Filha CR.; Braga JU.; Oliveira M.D.; Reis AS.; Corona F.; Neto SAS.; Andrade ESN.; Andrade TIB.; Jr ANR. A new scoring system for operational indicators guiding leprosy monitoring and surveillance in Brazil. One. Health Implement. Res. 2022, 2, 29-41. http://dx.doi.org/10.20517/ohir.2021.09
About This Article
Copyright

Data & Comments
Data
0

 Cite This Article 5 clicks

 Like This Article 15
likes
Like This Article 15
likes


Comments
Comments must be written in English. Spam, offensive content, impersonation, and private information will not be permitted. If any comment is reported and identified as inappropriate content by OAE staff, the comment will be removed without notice. If you have any queries or need any help, please contact us at support@oaepublish.com.